Peter Lambrechtsen rightly pointed out that COVID-19 per capita infection statistics aren’t as good as knowing the infection rate based on tests done, so at 2 a.m. I decided to crunch some numbers based on the stats I had on hand. These are many hours old now but hopefully still indicative of where things stand. Here you want a low percentage, and we are very fortunate to be sitting on 2·71 per cent. This site has tests per million as well, which I haven’t factored in. Taiwan and Hong Kong are looking even better on this measure; Australia isn’t looking too bad, either. The European and US numbers are sobering. Mainland China and the KSA haven’t released their testing numbers, only total infections.
I don’t really want to go into fatality rates.
France 98,010 of 224,254 = 43·70%
Spain 140,510 of 355,000 = 39·58%
UK 51,608 of 252,958 = 20·40%
USA 369,179 of 1,941,052 = 19·02%
Italy 132,547 of 721,732 = 18·37%
Sweden 7,693 of 54,700 = 14·06%
Switzerland 22,242 of 167,429 = 13·28%
Germany 104,199 of 918,460 = 11·34%
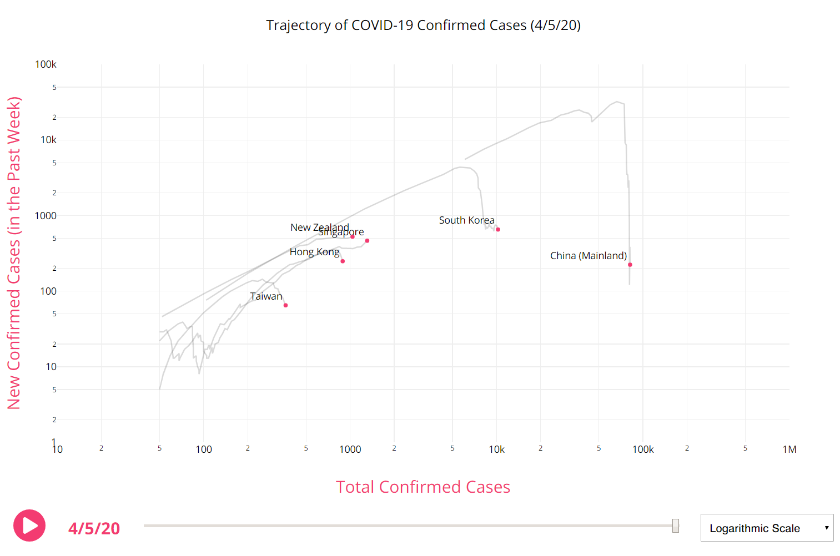
New Zealand 1,160 of 42,826 = 2·71%
South Korea 10,331 of 461,233 = 2·24%
Singapore 1,375 of 65,000 = 2·12%
Australia 5,908 of 310,700 = 1·90%
Hong Kong 936 of 96,709 = 0·97%
Taiwan 376 of 39,011 = 0·96%
You may also like