Virusncov.com
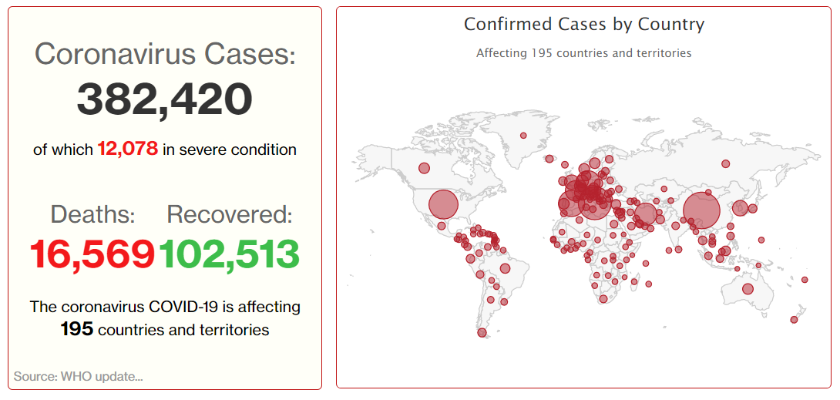
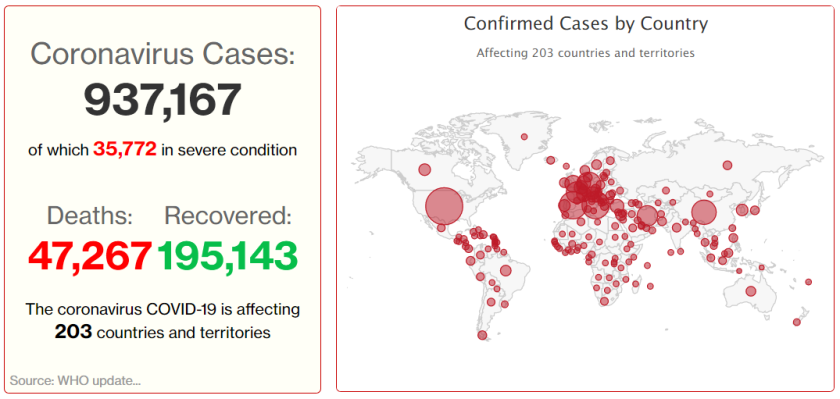
I don’t think it’s easy for most of us to make sense of the number of COVID-19 infections, especially as we’re recording more new infections daily. This website has some useful stats, and I was interested to see how we compared per capita.
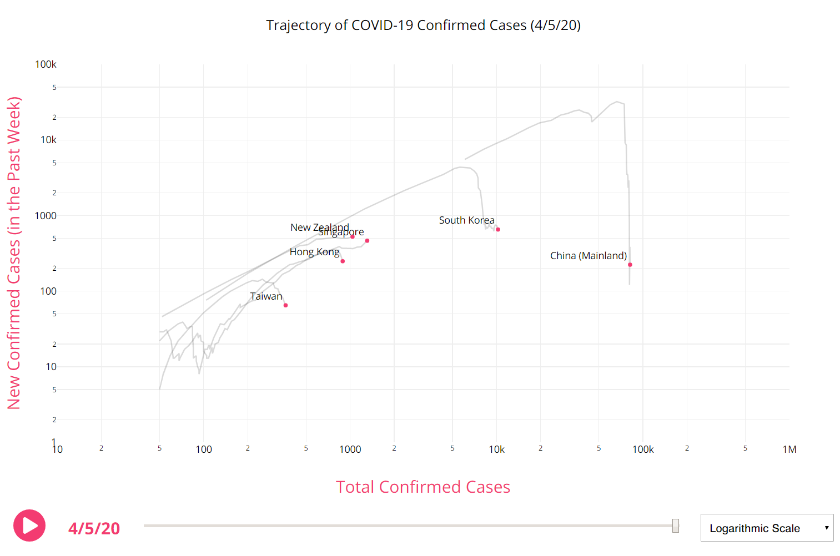
I know others might get more utility seeing how we creep up the scale (I notice a few of these graphs) but as a snapshot, I found this useful. I’ve thrown in other countries for comparison’s sake. The numbers deal with total infections (i.e. no subtractions are made for recovered cases).
COVID-19 cases per 1,000,000
Italy 1,056·9
Spain 751·6
Germany 347·1
France 304·4
Sweden 204·3
South Korea 176·3
USA 139·7
UK 98·1
Singapore 87·2
Australia 84·1
Mainland China 56·5
Canada 55·5
Hong Kong 47·7
New Zealand 32·2
KSA 16·2
Taiwan 9
I realize our numbers are set to rise because of Kiwis coming home and the virus incubation period, and the numbers will be reflecting our border situation and containment measures from two weeks ago rather than today. I’m looking forward to the day when the daily announcement of new infections shows a drop.
You may also like

One thought on “A quick look at COVID-19 on a per capita basis”